2020 IEEE PacificVis Visual Data Storytelling Contest Shortlist
2020 IEEE PacificVis Visual Data Storytelling Contest accepts video, data comic or infographic that uses visualization to communicate a narrative, a message or a series of insights. This year we received 27 submissions, which were reviewed by 10 judges, and ultimately 6 works were shortlisted. The winners will be announced during PacificVis 2020.
To view all shortlisted entries, please visit the Storytelling Contest Showcase on Vimeo.
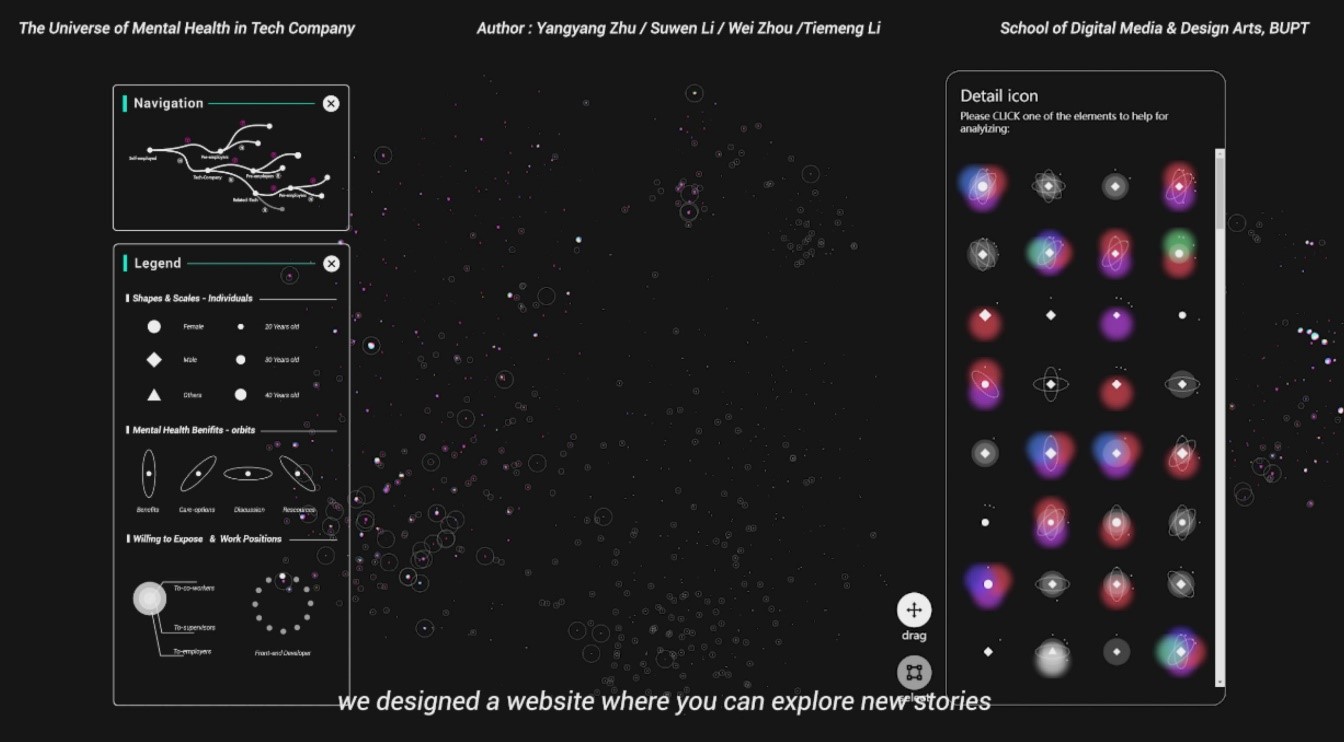
1: The Universe of Mental Health in Tech Company [Winner Award] [Work/Description] [Website] [Video]
| Yangyang Zhu | School of Digital Media and Design Arts, Beijing University of Posts and Telecommunications |
| Suwen Li | School of Digital Media and Design Arts, Beijing University of Posts and Telecommunications |
| Wei Zhou | School of Digital Media and Design Arts, Beijing University of Posts and Telecommunications |
| Tiemeng Li | School of Digital Media and Design Arts, Beijing University of Posts and Telecommunications Beijing Key Laboratory of Network System and Network Culture |
Abstract: Employees in tech companies are under enormous pressure due to their high intensity work. But many tech companies don't take mental health issues seriously. To remind tech companies to pay attention to the mental health of their employee, we visualized a questionnaire on the mental health of employees in tech companies conducted by OSMI. In our design, the employees of technology companies are metaphorically the stars in the vast universe; the position of the stars in the sky are determined by the result of vectorized data's dimension reduction. Combining the overview and detail views, we found some notable groups and stories. Finally, we published a website, which allows users to explore data freely through interactive operations.
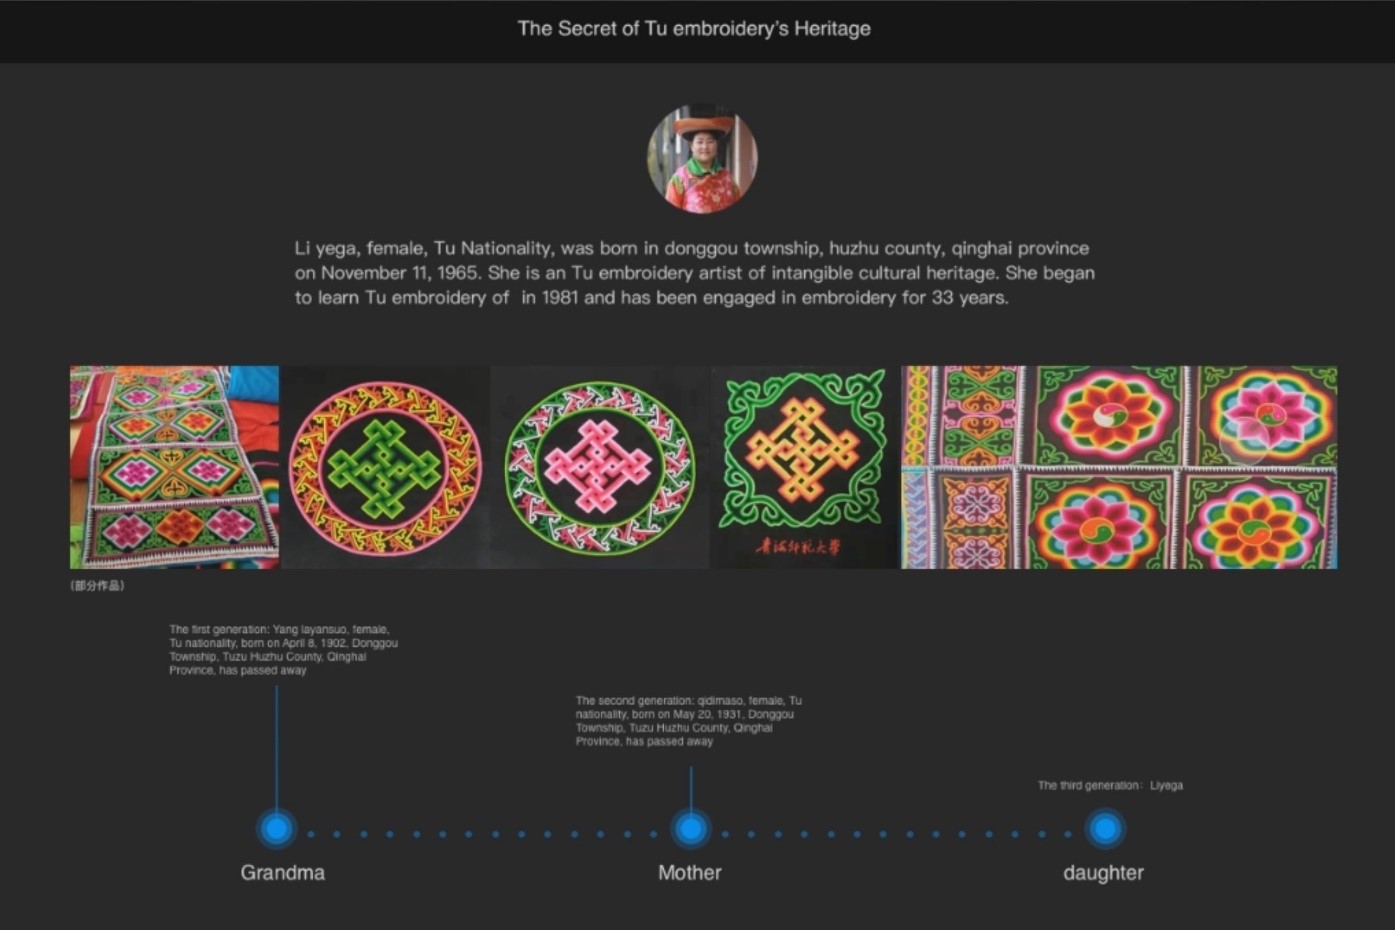
2: The Secret of Tu Embroidery’s Heritage [Honorable Mention Award] [Work/Description] [Video]
| Wanjun Zhang | Shanghai Academy of Fine Arts, Shanghai University |
| Xin Huang | Shanghai Academy of Fine Arts, Shanghai University |
| Song Anqi | Shanghai Academy of Fine Arts, Shanghai University |
| Qiansheng Li | Shanghai Academy of Fine Arts, Shanghai University |
Abstract:
Tu embroidery has experienced the rise and fall of a thousand years, containing rich national culture and wisdom. With the change of society, fewer and fewer people possesses pan embroidery skills, and plus the complexity of the embroidery technology, young people are more reluctant to learn tu embroidery. Tu embroidery inheritance began to face serious problems.
In this project we let two students to learn Tu embroidery from the craftman and use the data acquisition device to collect data in the process of embroidery of students and teachers. We have done a Interactive web page to tell people how to learn Tu embroidery and to explore Tu embroidery how to get better inheritance by means of using data visualization ways.
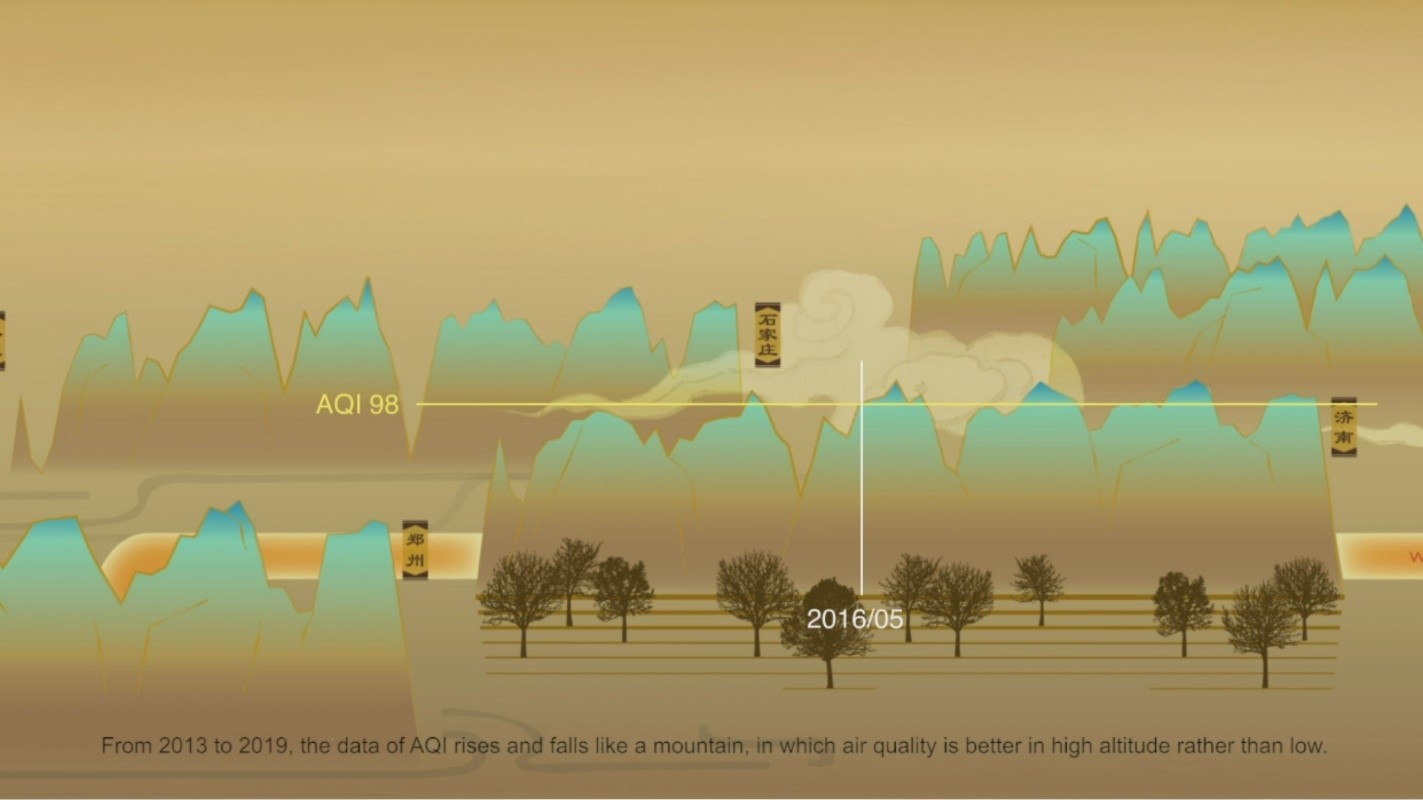
3: Storytelling with Natural Ecological Data [Video]
| Yanru Lyu | Beijing Technology and Business University |
| Juanjuan Long | Jiangnan university |
| Rui Wang | Jiangnan University |
| Juan Ni | Shanxi Provincial Academy of Arts |
| Ning Wang | Hebei Institute of Communication |
| Shuangyan Wang | Hebei Institute of Communication |
Abstract: Based on the theory of cognitive-communication, this work accomplished the transformation from “abstraction” to “concreteness” and then to “artistic conception” with the four types of data in the natural ecology: air quality, water quality, temperature and green coverage ratio through using the scenario approach. With the help of the visual language of Chinese landscape painting, it depicts the Chinese story of “Clear waters and green mountains are as valuable as mountains of gold and silver”, and realizes the three levels of cognitive experience of the viewers “attracted-understand-moved”.
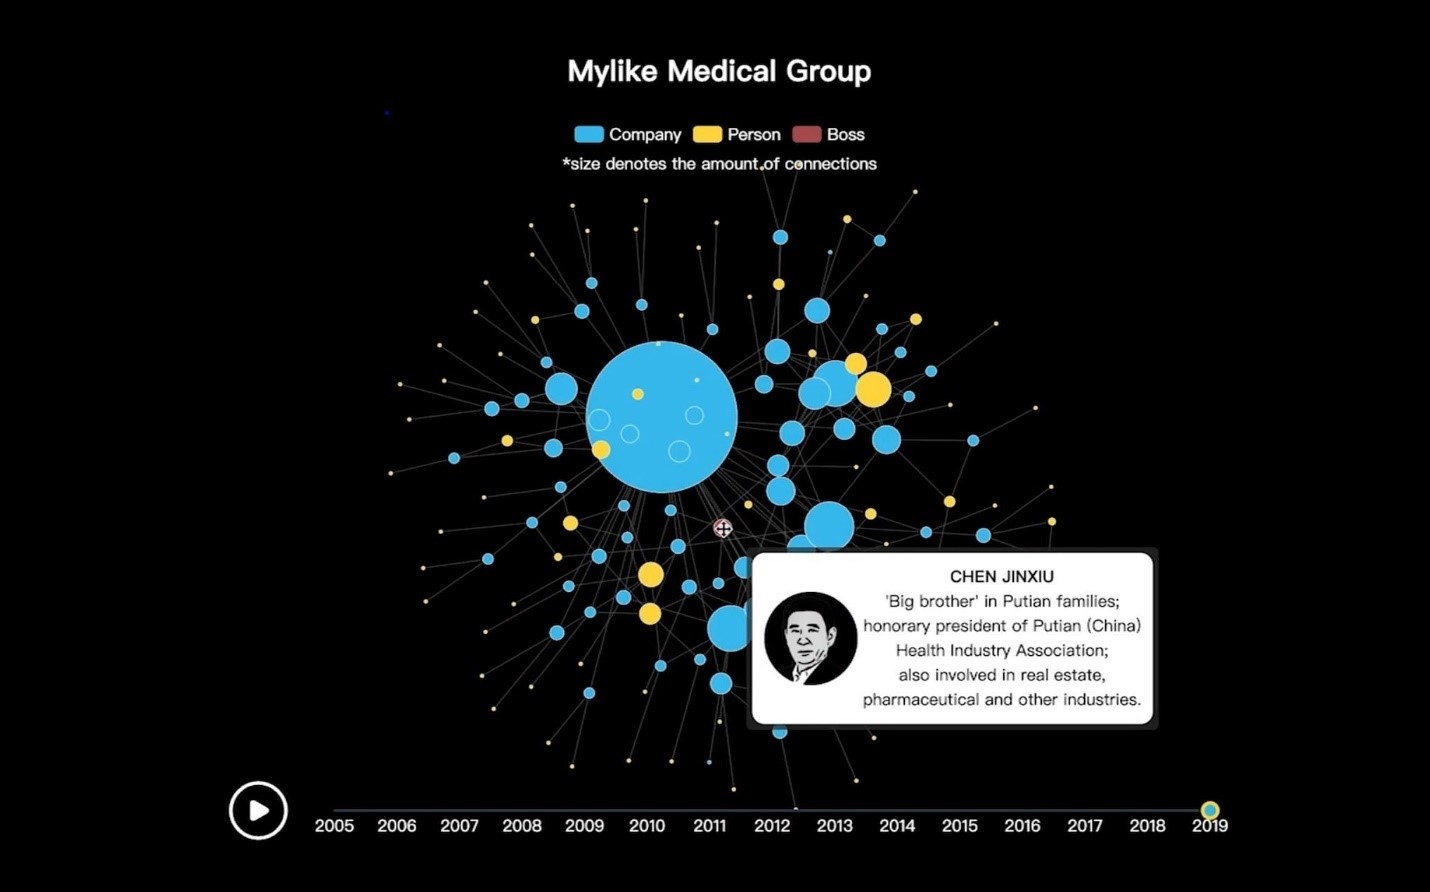
4: The Evolution of Putian Network [Website] [Video]
| Xingyu Lan | Intelligent Big Data Visualization Lab, Tongji University |
| Yueyao Zhang | Intelligent Big Data Visualization Lab, Tongji University |
| Jiati Liang | Independent Artist |
| Siukay Ye | Independent Artist |
Abstract: Although Putian is a small city in China, Putian families are well-known for their dominant power in the medical industry. To investigate their business network, we start with a long list published by China Business News. A total of 441 private hospitals controlled by Putian families are on the list. We then gathered the business information of 368 hospitals from Tianyancha (73 could not be searched), including the registration time, registered capital, stakeholders, administrative penalties and lawsuits. In this story, we first draw an overall portrait of the hospitals using an animated sankey diagram where hospitals are grouped according to categorical data (e.g., location). Next, we take a closer look at 3 big families and visualize the evolution of their business empire into node-link diagrams. To aid understanding, a bump chart is provided to summarize different business patterns. We analyze and visualize the data with Python, D3.js, Echarts, and Illustrator.
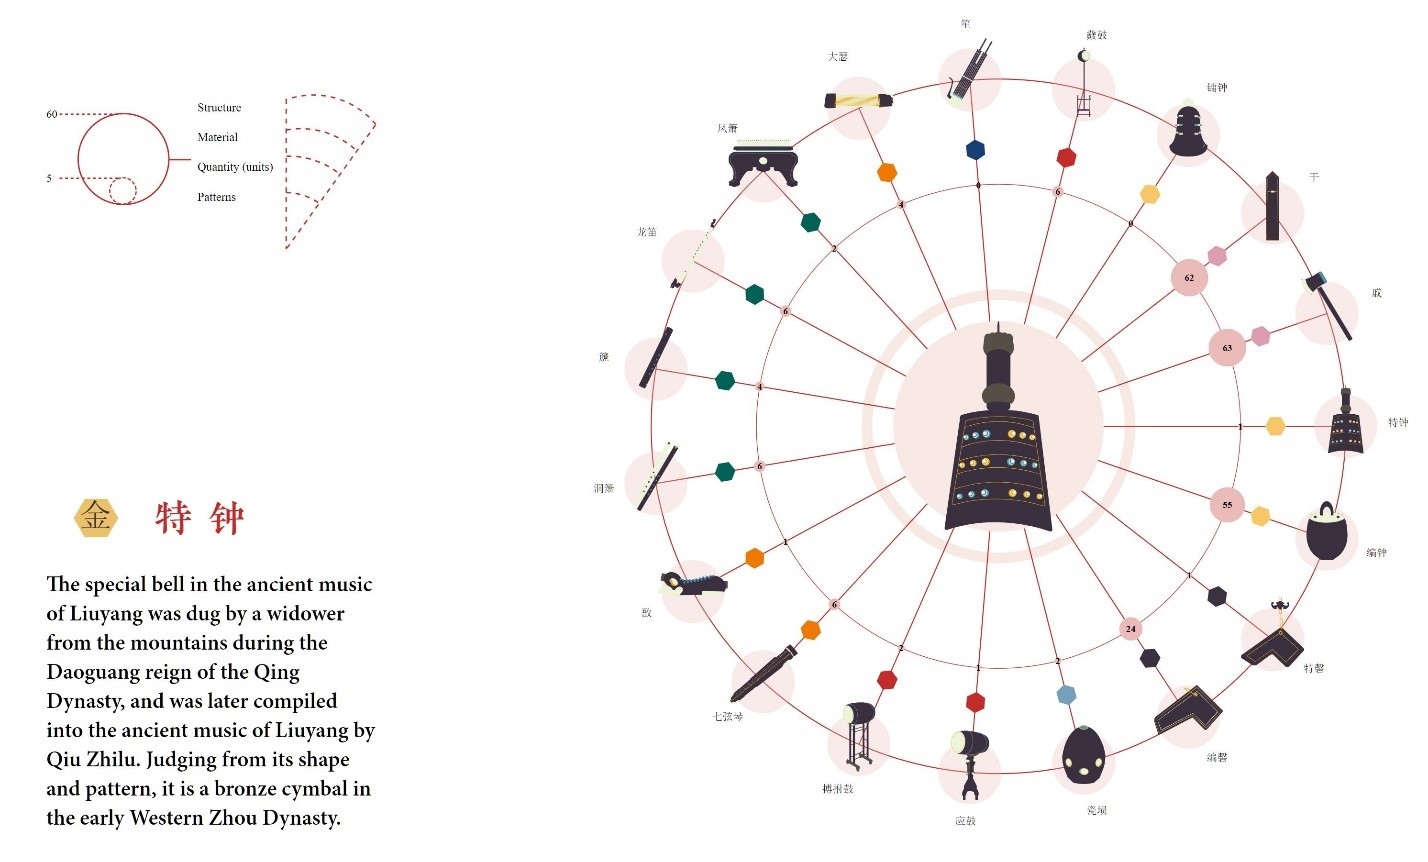
5: Guide to Chinese Musical Relics in Hunan [Work/Description] [Website] [Video]
| Juanjuan Long | Jiangnan University |
| Junlin Zhu | Jiangnan University |
| Wei Zhou | Jiangnan University |
| Rui Wang | Jiangnan University |
Abstract: This is an interactive and narrative website about musical relics in Hunan Province, China. The website is divided into 3 parts in chronological order, "ORIGIN OF MUSIC",“GUQIN OF LITERATI", "CONFUCIUS CEREMONY". The data used comes from materials published by Hunan Museum and relevant professional papers. We manually collected and cleaned out the information, and then completed the visualization design in forms of charts and illustrations. We focus on features, function, performance methods, performance occasion, music genres and so on. Users can not only learn details of each instrument, but also know what roles they played in the history.
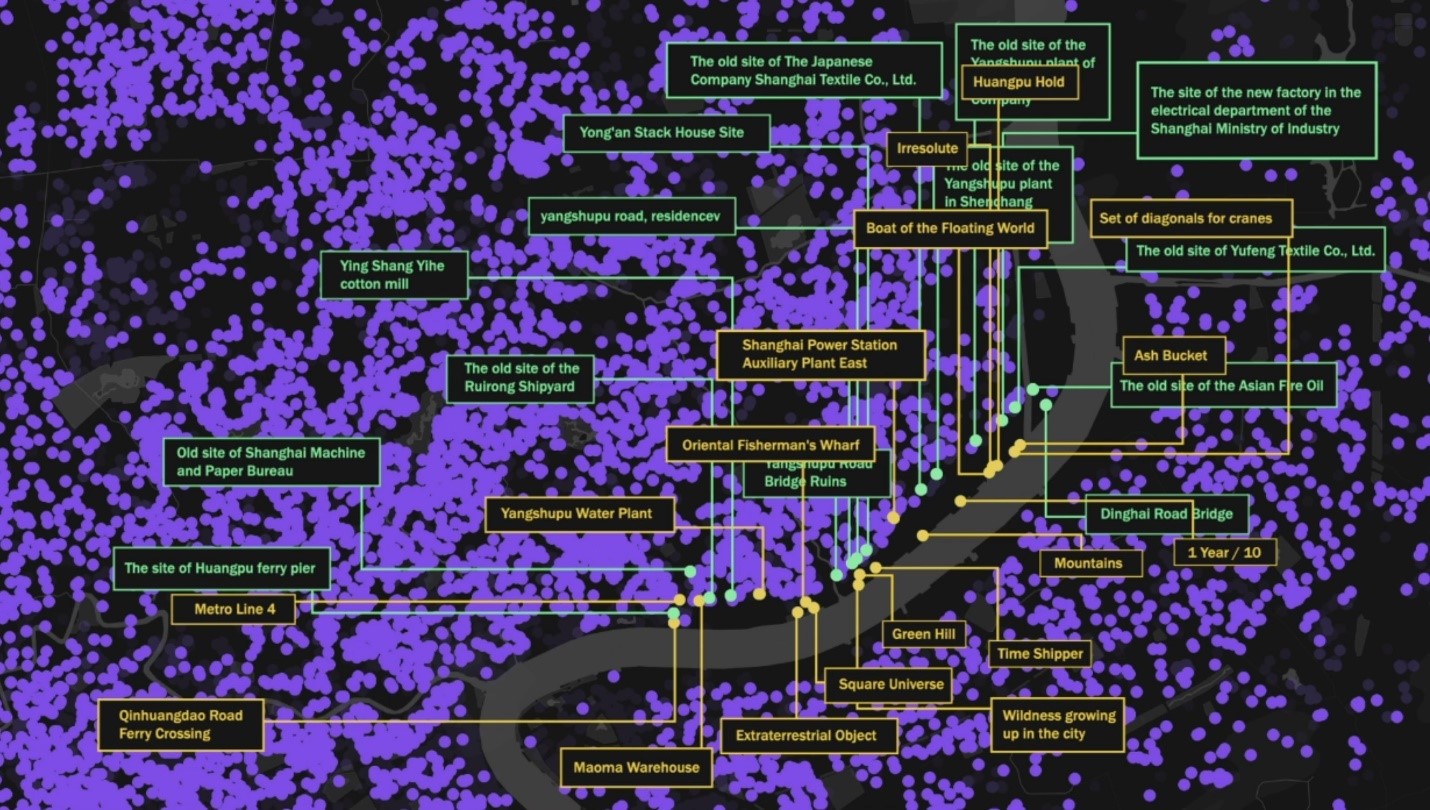
6: Visual Exploration of Public Art Construction in Shanghai [Work/Description] [Video]
| Yuqing Lei | Shanghai University |
| Beilei Hu | Shanghai University |
| Yuhao Chen | Shanghai University |
| Zhen He | Shanghai University |
| Qinxuan Wu | Shanghai University |
| Qiansheng Li | Shanghai University |
Abstract: Public art is becoming a way to re-promote cities. The purpose of our study is to explore the relationship between urban public art and the development of shanghai city. In order to reveal the pattern of public art construction in Shanghai, we have designed and produced a set of data visualization and interaction tools to analysis the POI data of the city with the data of public artworks by using different kinds of data, combined with the development outline of Urban Planning in Shanghai. At the same time, through interactive tools to obtain the public’s attitude of public art, we hope to be able to find out the public's preference of existing public artworks, and to provide the reference for future construction of public artworks.